Google Analytics 4 360 is a premium version of the best-known tool for analyzing user activity of websites and mobile applications, enriched with additional functionality and higher data processing limits. Thanks to the expanded options, we have the possibility of more advanced and more accurate data analysis than in the free version. In the article, you will read about five functionalities that will be an invaluable support in the daily work of an analyst or marketer.
Table of contents
- Extended data storage time
- Countering data sampling
- Quick update of data in reports
- Advanced data access management
- The full picture
- Summary
1. Extended data storage time
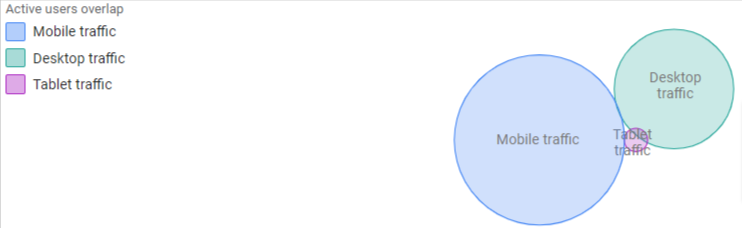
Imagine a situation in which you are asked to answer a question about whether users used mobile devices, tablets, and computers simultaneously in 2022. To do this, you can use the template in exploratory reports. Thanks to the fact that the data retention period in GA4 360 is 50 months you will be able to answer this question in a matter of minutes. This would not be possible in the standard version of the tool because the maximum data retention period is 14 months, meaning that in October 2023 we will not have data available for the entire year 2022.
The extended retention period of up to 50 months will also be indispensable for analyzing multi-year trends or seasonality.
Note that the data retention period is limited only by the exploration section. Standard reports do not rely on restrictions regardless of the version of the tool.
2. Countering data sampling
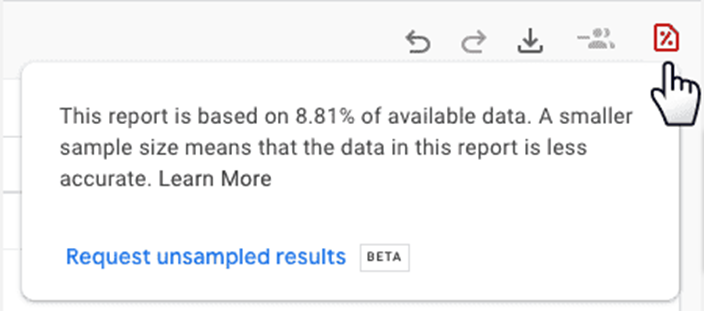
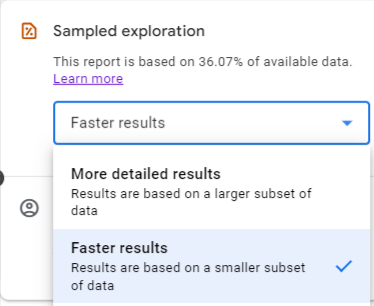
Data sampling is a statistical procedure used in Google Analytics 4 to generate data in reports based on representative groups rather than the total information collected. It is mainly used to speed up the tool. We can find out whether the report is sampled from the statement top message in the exploration section:
Data sampling in GA4 can be encountered mainly in exploration reports. However, with a very large number of users or the use of secondary dimensions, filters, or segments, it can also occur in standard reports.
The sampling procedure can affect the accuracy of analyses. The example below shows data over 30 days for a comparison of the hostname dimension with the display metric for the same site but two different versions of the tool. You can see that the difference in the number of impressions reaches 12%.

GA4 360 gives us two options for dealing with sampling in the tool panel:a) Adjusting the level of accuracy and speed. By selecting the more detailed results option, we can get an unsampled exploration.
a) Adjusting the level of accuracy and speed. By selecting the more detailed results option, we can get an unsampled exploration.
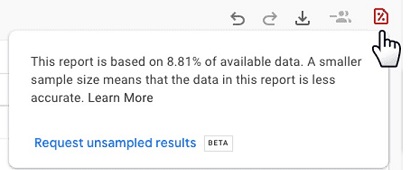
b) Request for unsampled results. Alternatively, if unsampled data is not available right away, there will be an option to send a request for an accurate report. Results will be available in most cases after about 30 minutes.
It is worth mentioning that in the standard version of the system, the only way to counter-sampling is to change the population size, for example, by shortening the date range.
3. Quick update of data in reports
In today’s fast-changing world, access to up-to-date data is very important. For example, if you’re running marketing campaigns that last for several days, your team needs to be able to analyze the results in real time. This will be possible, only in GA4 360, which in most cases (for Premium Normal and Large services) will be able to process data from 1 to 4 hours. From experience, we know that for standard services this time is a minimum of 24 hours. Efficient data updating can also allow us to implement corrective actions. For example, with up-to-date data, we can detect a sudden drop in the number of users or conversion rate caused by the publication of a new version of the site, and instantly take action to improve the situation.
4. Advanced data access management
For companies with diverse operations who want to manage data access in an advanced way, the functionality for creating subproperties will be helpful. These are simply subsets of the data that are in the master service. For example, you can separate a subproperty for each market in which you do business, for each brand, making it easier to analyze the data. A subproperty created for a marketing agency running a campaign on a specific platform will ensure that we are not forced to present all revenue data to partners, they will only get the information they need to run their optimizations. Note that adding the service mentioned above will involve an increase in license costs due to the processing of additional events, for example, attribution is modeled independently for the source and subproperties.
5. The full picture
Reviewing the data in the standard reports, you may come across a row with a dimension (other). The data is presented this way due to exceeding the limits of rows in the table. This is affected, among other things, by the types of reports (some reports have higher limits) or the complexity of the data set (additional dimensions, filters).
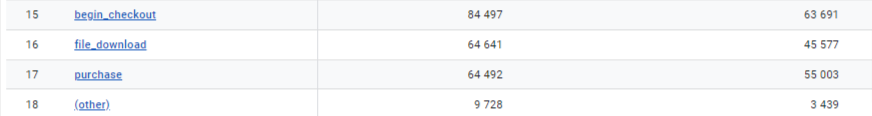
By hiding some of the data in a single line, we do not have the full picture. This can cause problems, for example, when analyzing the effectiveness of product categories. With complex category trees, data on some elements will be “hidden” in a row (other) and, as a result, we may not know which types of categories to eliminate from promotional activities. The lack of a complete picture can lead to the creation of erroneous marketing strategies. You will solve the problem of aggregating data to a single row with the functionality of automatic or manually configured expanded datasets.
Increased data limits, compared to standard GA4, will also help obtain full information on user behavior.

Thanks to the functionality of developed datasets and increased limits of processed information, we are able to fully understand our audience and make more accurate business decisions. Importantly, with the support of Full Stack Experts consultants, we are assured that the quality of the data we collect in the tool is at the highest level. This allows us to take full advantage of the potential of Google Analytics 4 360 and increase the effectiveness of our marketing efforts.
Tadeusz Skrzypczak, Head of Product&User Intelligence at Ringer Axel Springer Poland
Summary
Of course, some of the problems described in the article can be solved by substitute methods, for example, by creating custom scripts that minimize sampling and pass data to Big Query or another warehouse with the help of data science specialists or programmers. On the other hand, if we want all departments in the organization to speak the “language of data” we need to guarantee quick and easy access to it directly in the tool panel for every person involved in site optimization or marketing activities. Google Analytics 4 360, when properly configured, will give us such an opportunity, allowing more people to have an impact on increasing business efficiency.